 |
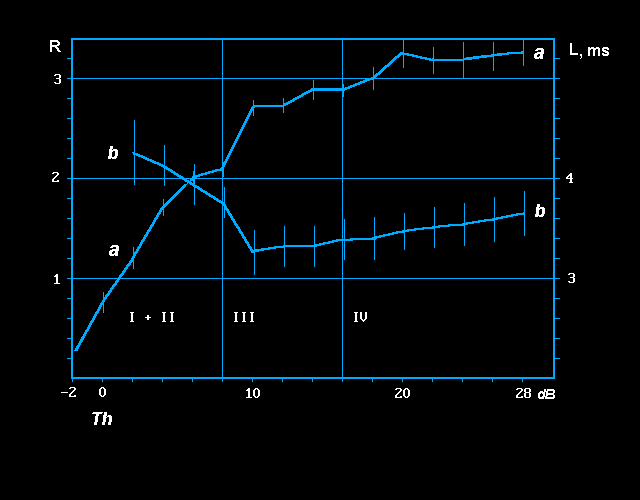
The relationship between the coefficient R and the amplitude of the stimulus (a) and plot of changes in the latent period L of the first spike in burst from the A1 cell (b). Zones I + II, III and IV denote regions of rapid increase in the probability for, respectively, the first, second, third, and fourth spike to occur in electrophysiological response. Bars show mean errors.