 |
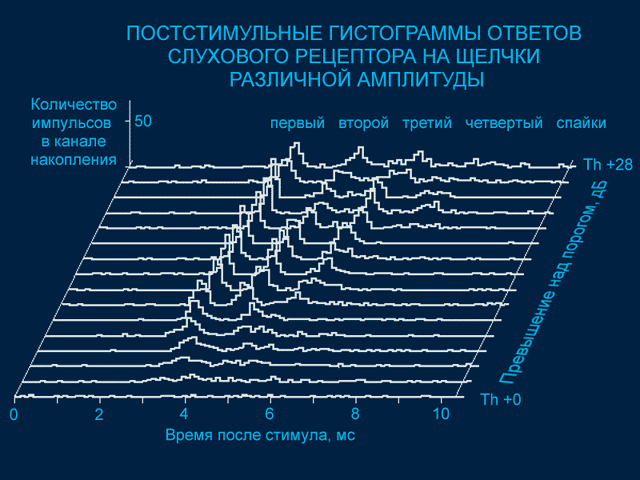
After-stimulus histograms of the A1 receptor response to a single impulse stimulus (Amphipyra perflua F.). Horizontal axis shows the time elapsed from the moment of stimulus presentation; vertical axis shows the number of spikes in a single detection channel (spikes/bin); inclined axis shows the relative amplitude of the stimulus from Th - 2 to Th + 28 dB. Th is a threshold amplitude (61 dB SPL). The resolution step is 0.1 msec/bin.