|
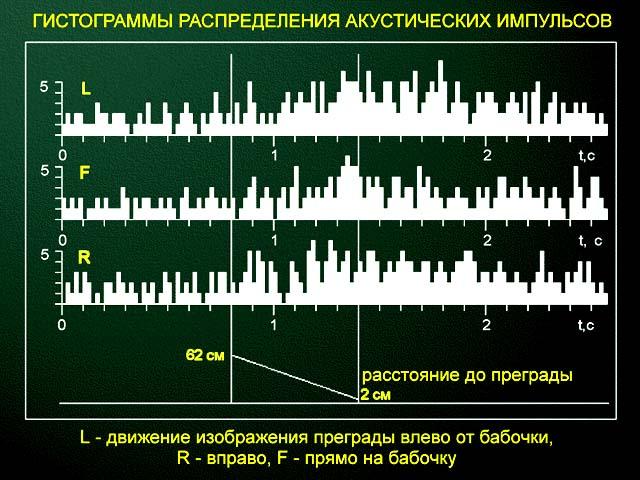
Histograms of the distribution of
acoustic impulses. The horizontal axis shows
time from the start of recording, in sec; the
vertical axis shows the number of impulses in
each recording channel. The quantization
step was 20 msec. Vertical lines indicate
the points of starting (0.8 sec) and ending (1.4 sec)
the visual stimulus imitating the movement of an
obstacle to the left (L), right
(R) relative to the insect,
and directly towards the insect (F). The diagram below
shows
changes in the calculated distance (et) between the
obstacle and the insect. Each
histogram was constructed using the results
of 21 stimulus presentations.