|
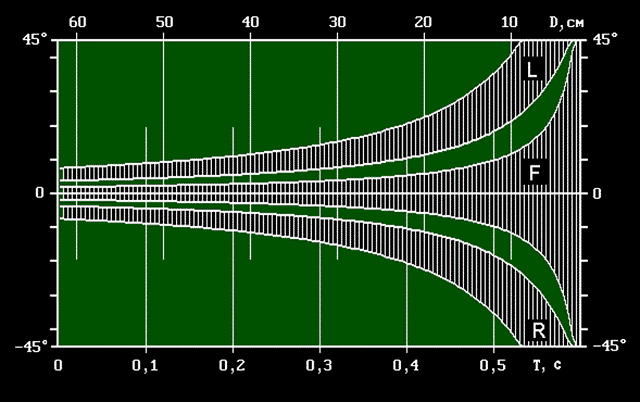
Plots of the angular position of
the edge of the stimulus in the field of vision
of the experimental moth.
L is the region in which shifts of the
obstacle to the left of the insect
were imitated;
R indicates shift of the obstacle to the right;
F indicates shift directly towards the moth.
The upper horizontal axis
indicates the calculated distance to the obstacle;
the lower horizontal axis shows time
from the start of signal presentation;
the vertical axis indicates the angle of
visualization.