 |
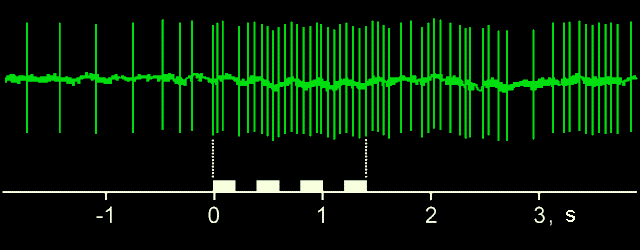
An example of moth's response (an increased frequency of click generation) to the above-threshold acoustic stimulation. Solid curve shows moth's movement in the horizontal plain; its rapid oscillations correspond to the single wingbeats. Vertical lines on the curve show the moments when the moth emitted clicks. Horizontal axis is the time from the first acoustic contact; solid rectangles above the axis indicate the intervals of stimulation.