 |
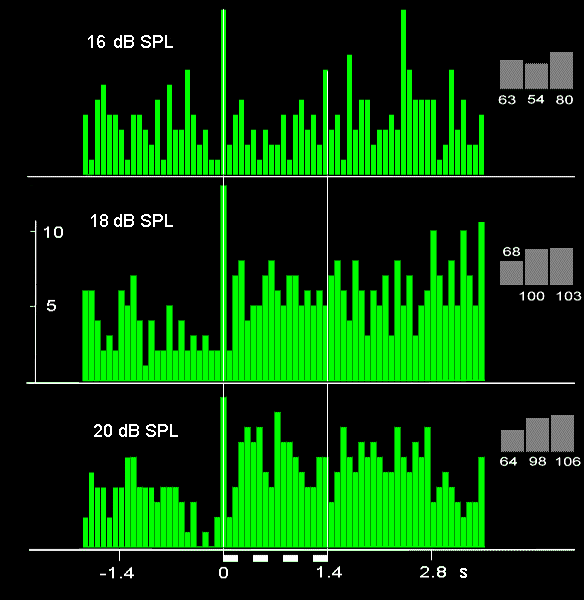
Distributions of moth acoustic emission rate at near-threshold levels of stimulation in B. satura (data from a single experiment). 16 dB SPL, 18 dB SPL (the threshold value, non-parametric Wilcoxon paired signed-ranks test, Ho<0.05) and 20 dB SPL. Every histogram is built from 10 responses to stimulation. The delay of stimuli was set to 6 ms, carrier frequency of stimuli is 50 kHz. Abscissa represents time scale, "0" corresponds to the moment of the first acoustic contact of the insect with the stimulator (i.e. the first pair "natural click - short puls"). The bin width is 80 ms. The height of each of the three shaded bars to the right of the distribution histogram corresponds to the total number of clicks during the following intervals of 1.4 s duration each: (-1.4 - 0 s) - background emission, (0 - 1.4 s) - emission during stimulation, (1.4 - 2.8 s) after-effect.