 |
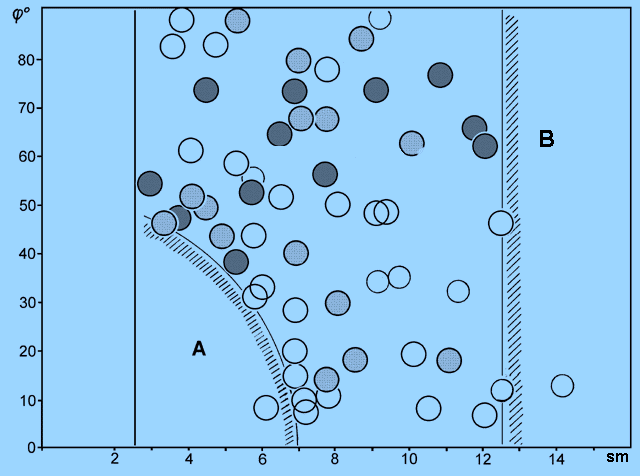
Diagram of the distribution corresponding to the responses of the experimental insects to an echo: light circles - positive echotaxis, shaded circles - negative echotaxis, black circles - flight around the obstacles. A, B - areas where the density is reduced in comparison with the neighboring areas.