 |
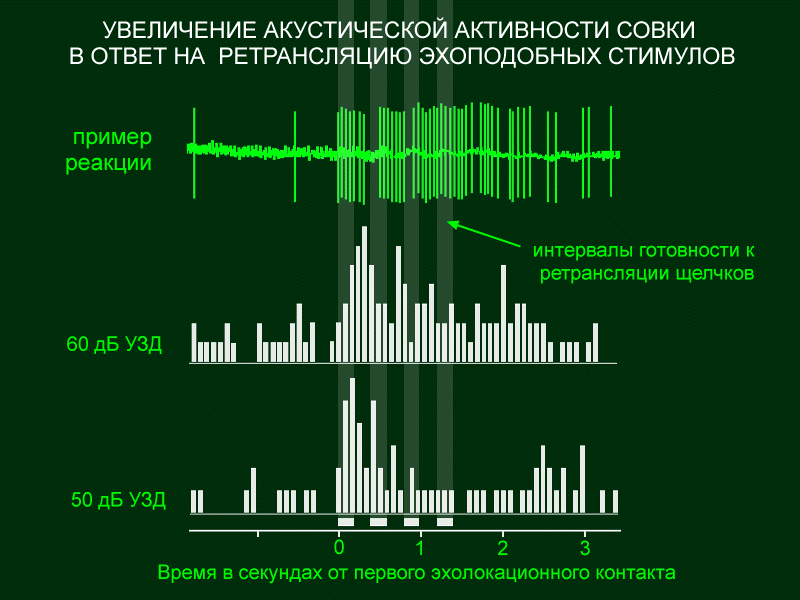
The distribution of acoustic signals (clicks) of the moth Agrotis
ypsilon Rott. in response to stimulation with retranslated
signals.
Central solid line on the upper recording -
moth's movements in a horizontal plane;
vertical lines, moments of
echolocational signal emission by the moth;
dark green
and
white bars - periods when
the setup replied to every moth's click with a
retranslated signal.
During and after stimulation the moth
emitted clicks more often.
Two histograms below the recording
show the changes in acoustic activity of
the moth, when stimulus amplitude was
50 and 60 dB SPL, which corresponds
to the amplitude of an echo in
the moth's natural conditions. The "0"
point on the time axis is a moment
of the first acoustic contact (moth's click
+ retranslated signal). When making histograms
every such first click was
not taken into account. Every histogram
includes results of 10 recordings.