|
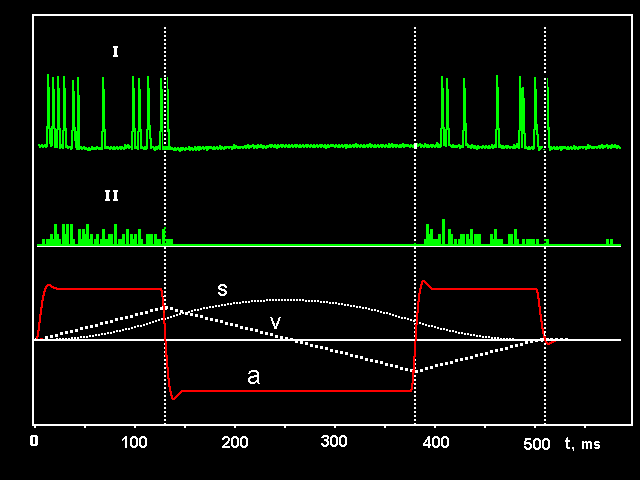
An example of the
response of neuron 10-3a, recorded from the right bundle, above the
terminal abdominal ganglion. The rotation angle
of the acoustic chamber was 30° relative to the insect.
I
- oscillogram of the response,
in which the spike amplitude is 66-70 mV;
II
- histogram showing the
distribution of spikes in time, using 10 stimulus presentations
and a channel width of 2 msec;
S, V,
and a
are plots of displacement, speed, and acceleration respectively of the air flow.
The horizontal axis shows the time from the start of stimulation.
The vertical dotted lines show the moment at
which the acceleration function was through the zero.