|
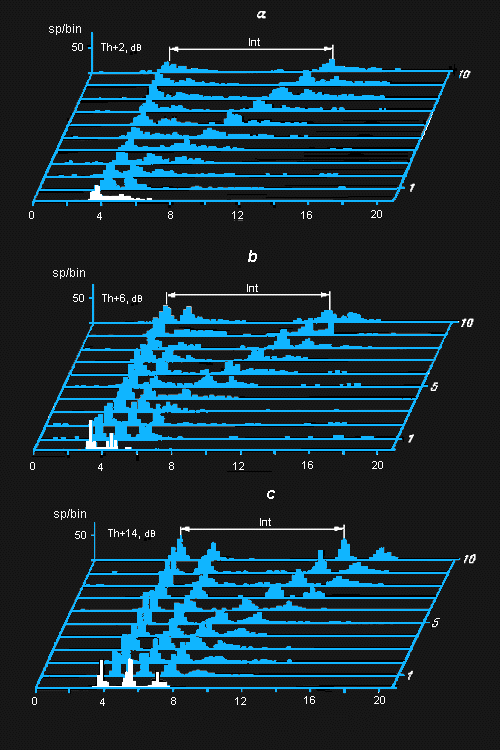
After-stimulus
histograms of the A1 receptor response to paired
stimuli of different amplitude (Amphipyra
perflua F.):
a - Th + 2; b - Th + 6; c - Th + 14 dB (Th=61
dB SPL). White
columns indicate
after-stimulus histograms for a single click
stimulus. (control). Horizontal axis shows the
time period from the moment of occurence
of the first click in paired stimulus; vertical
axis shows the number of spikes in a single
detection channel (spikes/bin); inclined axis
shows the interval between the first and
the second click in paired stimulus (Int),
in msec. Time resolution step is 0.2
msec/bin.