 |
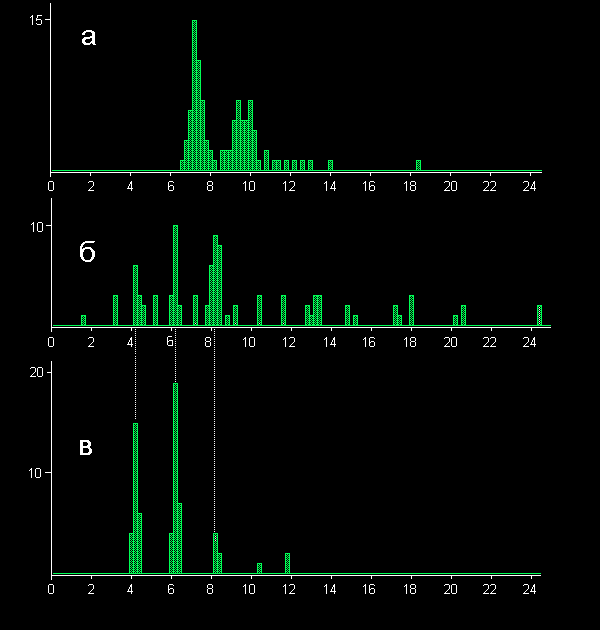
After-stimulus
histograms of impulses in the tympanal organ of an arctiid moth
(Arctia caja L.)
(the results shown were obtained in a single experiment):
à - histogram of the responses
of acoustic receptor A1 to ultrasonic clicks
(peak amplitude was 88 dB SPL);
á - the distribution
of spikes in tympanal nerve
after evoked tymbal clicks (the amplitude of discriminated
clicks was near the amplitude
of acoustic receptor A1 clicks);
â - the distribution of high-amplitude spikes
of the B-cell in response to evoked tymbal clicks.
Each histogram is plotted from the results of 50 stimulus
presentations. (Abscissa: time
from the beginning of stimulation in ms; ordinate:
number of impulses in accumulation
channel). Width of accumulation channel is 0.2 ms.