 |
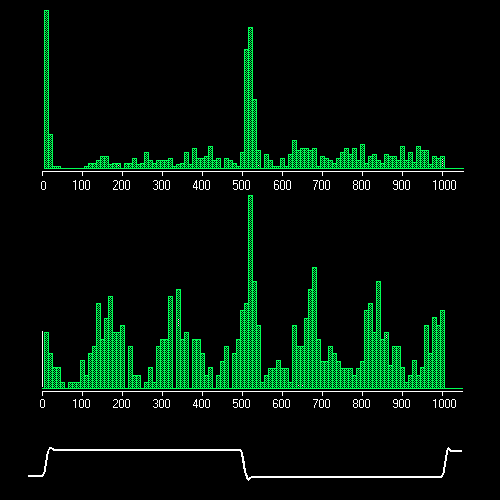
After-stimulus histograms of the B -cell
responses of two specimens of (Arctia caja L.) to pushing
the upper part of the metepisternum.
Each histogram is plotted from the results of 100 stimulus presentations.
(Abscissa: time from the beginning of mechanical stimulus in ms;
ordinate: number of impulses in accumulation channel).
Width of accumulation channel is 10 ms.
The